Executive Insight

The CX Turning Point

Where loyalty, strategy, and leadership face their next test

The age of the one number

For nearly two decades, a single metric defined loyalty. It promised to connect how customers feel to how companies grow.

The simplicity was seductive: a single question — “Would you recommend?” — became the industry’s answer to complexity.

Net Promoter Score (NPS)® changed how leaders measured loyalty — but not how they managed it.

The promise of Net Promoter began to crack in 2007, when a landmark longitudinal study tested the claim that NPS was “the single most reliable indicator of growth.”

Today’s CX turning point is about restoring what NPS first promised: a clearer link between customer truth and business growth.

Net Promoter, NPS, NPS Prism, and the NPS-related emoticons are registered trademarks of Bain & Company, Inc., NICE Systems, Inc., and Fred Reichheld. Net Promoter Score and Net Promoter System are service marks of Bain & Company, Inc., NICE Systems, Inc., and Fred Reichheld.

“NPS couldn’t predict growth because it never measured what causes it.”

The longitudinal reality

In 2007, Journal of Marketing published the most thorough test of the NPS growth claim to date: A Longitudinal Examination of Net Promoter and Firm Revenue Growth.

What the Data Revealed

The analysis confirmed that correlation is not causation — recommendation alone didn’t drive growth; satisfaction did. Tracking multiple industries and brands over time with actual revenue data, the researchers concluded:

“The study fails to reproduce the results that made Net Promoter famous — showing no reliable connection between its scores and real-world growth outcomes.”

In plain terms: NPS did not outperform other satisfaction measures. Correlations were inconsistent at best and nonexistent at worst.

The 2007 Journal of Marketing study didn’t disprove loyalty economics. But it disproved the industry’s shortcut.

The simplicity of the score long defined success, even as its limitations went unchallenged. In the re-examination of the original NPS claims, the 2007 study found that the problem wasn’t the data — it was how the results were interpreted.


Simplicity or Certainty

Yet the market largely moved on. Once boards demanded a single number, leadership agendas aligned around it. Consultants promoted NPS because it was profitable, not because it was predictive. Vendors could package it, benchmark it, and broadcast it with ease.

Executives — using the measurement approach widely endorsed at the time — could present a clean, digestible number to boards and shareholders, a signal of confidence in an uncertain market marked by rising competition and shifting consumer behavior.

The industry didn’t adopt NPS because it was the most predictive. it adopted it because it was the most usable.

The myth of the one number

The Simplicity of the One Number…and the Clarity It Cost

The idea of linking service to revenue growth and profitability was first introduced in 1994 through Harvard’s Service-Profit Chain — a management model that demonstrated how employee experience, customer satisfaction, and loyalty work together to drive sustained financial performance.


When Simplicity Took Over

A decade later, Bain & Company’s Fred Reichheld drew inspiration from that same model but sought to make it faster and easier to use.

He replaced the chain of relationships with a single question — “Would you recommend us?” — and turned the response into a single score: the Net Promoter Score (NPS).

By reducing the chain to one number, NPS made measurement easier — but it made finding meaning in the data harder.

The genius of NPS was its simplicity — a score promising to translate advocacy directly into growth.

But what began as an elegant shortcut soon narrowed how leaders understood loyalty itself.


Confidence or Clarity?

When the Service-Profit Chain was condensed into a single metric, organizations lost the behavioral truth that once connected customer emotion, effort, and performance.

Simplicity gave leaders confidence and a way to compare themselves to peers.

Gradually, confidence replaced clarity. The focus on rankings and scores began to color how success itself was defined.

The change didn’t happen all at once — it unfolded over time.

“The single score didn’t make loyalty easier to measure — it made it harder to manage.”

The Experience Era

The modern experience era didn’t emerge all at once. It unfolded over years of well-intended simplification — each step narrowing what leaders measured and ultimately disconnecting results from the customer behaviors that drive them.

A proven, loyalty-based behavioral model gave way to a simpler scoring era — not by decision or intention, but by gradual drift.

The timeline reveals how that drift occurred.

“What changed wasn’t loyalty — it was the industry’s visibility into its drivers.”

Modern Research Restores What NPS Oversimplified

The Service Profit Chain Redeemed

The industry didn’t need a new answer — it needed to return to the right one: the original economic model of loyalty that linked experience, emotion, behavior, and financial performance. The discipline set aside over time is now the discipline that separates growth leaders from growth chasers.

It is the same enduring discipline that demonstrates—predictably and repeatedly—how strong experiences create the emotions that drive the three outcomes every business depends on: retained business from customers who stay, repeated business from customers who buy again, and referred business from customers who advocate to others.

Today’s evidence reconfirms this foundation — restoring the discipline the industry drifted away from. Institutions that return to it will define the next decade of growth.

Where the research stopped — and practice continued

With the original loyalty model restored, the next question becomes clear: what evidence shows where loyalty actually begins and breaks?

The 2007 Journal of Marketing study showed what didn’t drive growth, but it didn’t reveal what actually does.

When research paused, a few practitioners stayed focused on the only reality that predicts loyalty: customer behavior.

From that work, three priority actions, or levers, emerged:

Isolate Early Triggers

Identify real-time signals that precede renewal, referral, or attrition.

Diagnose Friction Precisely

Expose root-cause barriers that erode confidence and undermine discipline.

Predict & Prevent Loss

Detect early warning signs and intervene before they turn into attrition.

What this means in practice

When teams have real-time insight into what customers actually do next, execution strengthens, friction declines, and loyalty becomes repeatable, not accidental.

With a clear line-of-sight, execution flows seamlessly throughout the operation — reinforcing retention and reducing preventable loss — and leaders see risk early, long before it reaches the balance sheet.

The next step is seeing where those early behavioral fractures actually begin — and what makes them visible long before traditional metrics ever do.

“Right measurement reveals truth. People doing the right things at the right time bring it to life.”

NPS × Customer Effort Matrix (Support EXP 150K Dataset, 2023–2025)

Executive Insight: Ease of Doing Business — Not NPS — is the Stabilizing Force Behind Customer Loyalty

As ease of doing business rises, loyalty stabilizes.

As effort rises, loyalty fractures — regardless of NPS.


Key Insight:

  • Even Excellent and World-Class NPS cannot overcome friction.
  • High-effort promoter interactions reveal early, silent attrition risk.
  • Durable loyalty emerges only where NPS and Ease of Doing Business converge.

Even inside Bain’s Excellent and World-Class ranges, the pattern is unmistakable:

Customer effort continues to shape loyalty on its own.

About the Dataset

This analysis draws from 150,000+ customer interactions captured by Support EXP across multiple years, channels, and top-performing financial institutions—most scoring within Bain’s Excellent (50+) to World-Class (80+) ranges. Each dot represents a unique institution × channel interaction. Within this high-performing environment, elevated effort exposes early behavioral instability that NPS alone cannot detect.

This fracture becomes more consequential when leaders move from measurement to discipline — acting on what customers may do next: deepen, pause, or disengage.


MODERN TRUTH

From a single score to a system of foresight

The leaders who embraced data discipline weren’t chasing reassurance metrics. They were shifting to a principle that even decades ago proved true: growth follows what customers do — not what they say.

The original Service-Profit Chain showed that a superior experience — when delivered consistently — creates loyalty and financial return. Yet most measurement systems reduced this insight to a single score, blinding leaders to friction, root causes, and early behavioral signals of loss.

As early as 2010, Harvard Business Review identified a truth modern research now strongly reinforces: 94% of customers reporting high effort were less likely to repurchase — and more likely to leave.

Today’s competitive reality demands a discipline of interpreting customer emotion, effort, and behavior together so leaders see the true drivers of retention and growth.

This is the foundation of foresight: connecting performance to customer feedback through a system that makes risk visible, opportunity actionable, and decisions more precise.

“Loyalty is shaped by what customers feel, and by how those experiences influence what they ultimately choose to do.”

The Modern Gold Standard

Today’s leading CX systems integrate 3 complementary metrics

CSAT_icon

Customer Satisfaction

“How satisfied were you with your experience?” reflects immediate service quality and emotion.
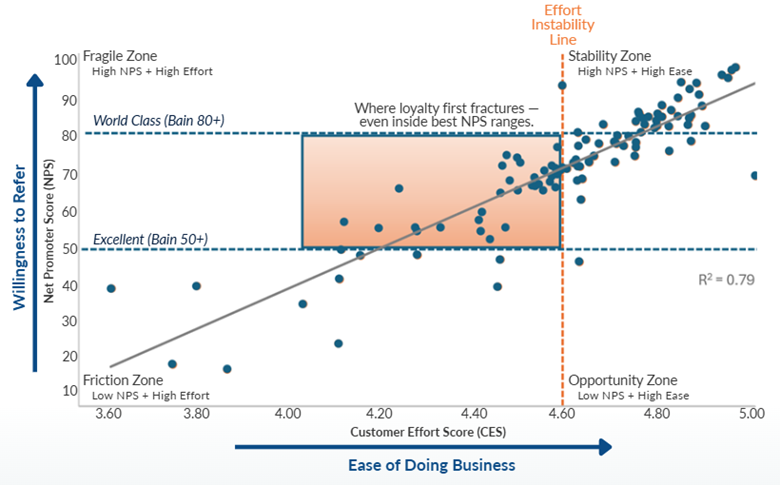
NPS_icon

Net Promoter Score

“How likely are you to recommend us?” reveals overall sentiment—but not what drives it.

CES_icon

Customer Effort Score

“How easy was it to do business?” exposes the friction points that cause attrition.

Together, they form the modern gold standard in CX management, uniting customer emotion, effort, and outcome into one system of foresight for growth and risk prevention.

Where integrated experience becomes measureable, customer behavior becomes manageable, and growth becomes intentional.

The under-45 inflection: loyalty in motion

Rewriting Loyalty

The next evolution of loyalty is being written by the under-45 generation: millennials and Gen Z consumers whose expectations are reshaping every industry. They aren’t inheriting loyalty’s old playbook; they’re rewriting it.

Why the Next Generation Matters

These consumers are digitally fluent, friction-averse, and ready to move their business at the first sign of disconnect. They don’t wait for change — they create it. Their loyalty is fluid, earned one seamless experience at a time, and lost in a single moment of effort or delay.

Their feedback and behavior must be viewed apart from the whole. Averaging their data into legacy metrics repeats the one-number mistake — masking both risk and opportunity. Seeing this generation clearly takes courage; acting on it creates advantage.

This is the decade to earn their loyalty — to design experiences that feel personal, effortless, and immediate. The under-45 segment isn’t just another audience; it’s your future base of borrowers, depositors, and advocates. Lose them now, and you lose what anchors the next generation of growth.

What the Under-45 Generation is Telling Us

Switching speed

Nearly 40% of Gen Z and 30% of millennials would switch banks after one poor digital experience (BAI, 2024).

Friction intolerance

70% rank “ease of doing business” above rate or reward (Accenture Global Banking Study, 2025).

Borrower impact

By 2035, this cohort will hold over half of all consumer loans and primary checking accounts (McKinsey, 2025).

“Millennials and Gen Z aren’t inheriting loyalty; they’re rewriting it.”

The <45 generational shift becomes unmistakable when the data comes into view.

Executive Insight: The Younger the Customer, the Sharper the Consequences of Friction

Under-45 loyalty is highly elastic. When ease is present, their loyalty accelerates; when friction appears, it collapses just as fast.

The curve is steeper, as this generation is more reactive and far less forgiving than customers 45+.

This generation doesn’t inherit loyalty — it responds to experience in real time.

Executive Takeaways:

  • Ease is the ignition switch for <45 loyalty.
  • Even minimal friction triggers immediate defection risk.
  • 45+ loyalty remains stable; <45 loyalty does not.
  • Removing friction early is now a growth imperative.
Under-45 Curve: Loyalty rises sharply with ease — and collapses immediately with friction.
45+ Curve: Loyalty improves with ease but remains steadier and more tolerant of friction.

A small subset of under-45 responses fall into negative NPS territory, reflecting this segment’s sharper and less forgiving reaction to friction. These outliers do not alter the strong overall correlation between ease and loyalty—but they do illustrate how quickly loyalty collapses when experiences become difficult.

Support EXP Combined Dataset, 2023–2025

For leaders, the takeaway is clear: to win the next decade of loyalty, businesses must design and execute experiences that remove friction before it’s felt. For Gen Z and millennials, ease isn’t what earns their loyalty — ease is what allows loyalty to begin.

“This generation doesn’t inherit loyalty — it responds to experience in real time.”

From insight to alignment

The path forward becomes clear when the data is translated into aligned leadership action.

The data makes the next step plain: leaders must align around the behaviors that drive growth. Advantage now belongs to institutions that unify measurement, decisions, and strategy around what customers actually do — not what scores alone suggest.

Alignment must flow through leaders, teams, systems, and every frontline and digital touchpoint.

Where Leadership Must Align:

Align Measurement to Customer Behavior

Anchor metrics to the behavior that drives growth. Replace fragmented scoring with a unified model that isolates stay / buy / tell signals behind loyalty, friction, and financial risk. When measurement reflects behavior, leaders see momentum, drag, and where intervention matters.

Align Leadership to Behavioral Reality

Give senior teams a shared, precise view of where performance is strengthening or eroding. Operating from the same behavioral insight framework sharpens accountability, accelerates execution, and moves the organization in one direction.

Align the Boardroom to Economic Levers

Provide executives and boards with a single, unambiguous view of the behaviors behind retention, share-of-wallet, and lifetime value. Go beyond the ‘likelihood to recommend’ score to see how experience translates into real customer behavior. Behavioral truth strengthens strategy and makes growth more predictable.

Executive Priorities:

  • Unify measurement around behavior, not sentiment
  • Give leaders real-time visibility into lift, leakage, and loss
  • Equip the board with economic clarity behind retention and value

When alignment is complete, leadership must operationalize it — with a new discipline for how CX is seen, measured, and acted on.

From alignment to leadership

Questions Modern CX Leaders Ask

Where modern leaders focus their attention

The new standards of modern CX leadership

Leadership now becomes the difference between seeing the truth — and acting on it.

Modern leadership requires a different way of seeing, measuring, and acting. It begins with a shared, unfiltered understanding of what customers actually experience — and how those experiences influence what they choose to do next.

Lead the turning point

The mandate for leadership is clear:

Institutions don’t win loyalty by watching scores — they win it by managing the actions that create growth. The next era belongs to leaders who confront reality early, interpret friction before it becomes loss, and align teams and systems around what customers actually do.

The Turning Point is here.

The leaders who choose to see farther will shape the decade ahead.

“Foresight, discipline, and truth will define the next era of growth.”

Executive Source Notes

Foundational Research and Frameworks

Heskett, J. L., Sasser, W. E., & Schlesinger, L. A. (1997). The Service Profit Chain: How Leading Companies Link Profit and Growth to Loyalty, Satisfaction, and Value. The Free Press.

Reichheld, F. F. (2003). “The One Number You Need to Grow.” Harvard Business Review, December.

Keiningham, T. L., Aksoy, L., Cooil, B., Andreassen, T. W., & Weiner, J. (2007). A Longitudinal Examination of Net Promoter and Firm Revenue Growth. Journal of Marketing, 71(3), 39–51.

Dixon, M., Freeman, K., & Toman, N. (2010). “Stop Trying to Delight Your Customers.” Harvard Business Review, July–August.


Experience Era and Evolution

Pine, B. J., II & Gilmore, J. H. (1998). “Welcome to the Experience Economy.” Harvard Business Review, July–August.

HBR Analytic Services (2024). The Experience Transformation Imperative. Harvard Business Publishing.


Modern Proof: Experience Still Outperforms Simplicity

McKinsey & Company (2023). Experience-Led Growth: A New Way to Create Value.

Bloomreach & eMarketer (2025). Emotional Connections Drive Brand Loyalty in Today’s Economy.

Qualtrics XM Institute (2025). Capture the Financial Value of Customer Emotions.

Forrester Research (2024). Customer Experience Index Report.


Contemporary Industry Research

BAI (2024). The State of Customer Experience in Financial Services.

Accenture (2025). The Human Advantage in the Age of AI: How Empathy Powers Growth.

McKinsey & Company. (2025). The Under-45 Consumer: The New Loyalty Divide.


Critical Analyses of NPS

Stahlkopf, K. (2019). “Is the Net Promoter Score Still Useful?” Harvard Business Review Digital Articles.

Baehre, M. (2022). “The NPS Illusion: Rethinking Loyalty Metrics for Real Growth.” CX Network Journal.


Support EXP Research and Frameworks

Support EXP (2025). Beyond the Score™ Methodology: Connecting Emotion, Effort, and Behavior.

Support EXP (2025). Insight Builder™, Relationship Builder™, and Team Builder™ Frameworks.